Website load time and speed statistics in 2026
Feb 02, 2026
/
Jordana A.
/
9 min Read

Website load time has a major impact on user engagement, trust, and conversions from the first second, making it particularly crucial in ecommerce.
The industry benchmark for load time is 2 seconds, yet the average page load time is 2.5 seconds on desktop and a much slower 8.6 seconds on mobile devices. Unoptimized images, bloated plugins, custom fonts, third-party scripts, inefficient code, and poor hosting are common factors that slow down performance.
Understanding industry benchmarks and what users expect from business websites helps you stay competitive. These insights let you assess your current metrics and set clear optimization goals for your website.
Top 10 website load time statistics for 2026
- Nearly half of users expect a website to load within two seconds or less, making quality web hosting essential for a positive user experience and engagement.
- Around three-quarters of mobile users say they’ve encountered a website that was too slow to load, ranking it above other common issues like error messages, bad formatting, broken functionality, and site unavailability.
- 53% of mobile users leave a website if it takes over three seconds to load, highlighting the need to keep load times below this limit, especially on mobile.
- Customer satisfaction can drop about 16% with just a three-second wait. With 44% of shoppers sharing bad experiences, speed is vital for brand reputation.
- A one-second page delay can cut conversions by 7%, potentially costing large businesses millions in lost revenue.
- Over three-quarters of a webpage’s total weight comes from images, the biggest performance bottleneck for most sites.
- 67% of websites recorded fast Largest Contentful Paint (LCP) scores, meaning their main content loaded within the first 2.5 seconds.
- More than 40 million websites are using content delivery networks (CDN) to speed up load times by delivering content from servers closer to users.
- WordPress websites load in an average of 2.5 seconds on desktop and 13.25 seconds on mobile, making mobile performance optimization especially important.
- About 92% of enterprises adopt multi-cloud strategies to optimize cost and performance.
What is website load time?
Website load time is the measure of how long it takes for a page to fully display its content after a user clicks a link or enters a URL. It’s usually measured in seconds and can vary depending on factors like the user’s internet connection, device, browser, and your website’s technical setup.
As a core aspect of website performance, load time plays a direct role in user experience, search engine rankings, and conversions. A slow-loading site can frustrate visitors and lead them to leave before the page finishes loading, making load time one of the most important metrics to monitor and improve.
What is the average load time for a website?
The average page load time is 2.5 seconds on desktop and 8.6 seconds on mobile. While this desktop speed is generally acceptable, mobile performance still lags behind what users expect. This contrast highlights the importance of testing website speed and improving mobile load times to meet growing expectations for speed on all devices.
- Nearly 3 in 4 mobile users have experienced a slow-loading website. This is the most reported issue, followed by error messages (51%), bad formatting (48%), broken functionality (45%), and site unavailability (38%) (Kissmetrics).
- 3% of mobile users leave if a website takes longer than one second to load. The majority (30%) are willing to wait 6-10 seconds, suggesting that while instant load times are ideal, users might allow moderate delays before abandoning a website (Kissmetrics).
- Over half of mobile users leave a site if it takes more than three seconds to load. While some users tolerate short delays, this sharp drop-off highlights how crucial it is to keep load times under the three-second mark, especially on mobile (Google).
- 67% of websites had fast Largest Contentful Paint (LCP) scores in June 2025. This Core Web Vital metric measures how quickly a page’s main content loads and should occur within the first 2.5 seconds. However, only just over half of websites meet Google’s benchmark (Google Chrome for Developers).
What slows down a website?
Poor-quality code, third-party scripts, and bad web hosting can hurt page load time. Your hosting setup, content delivery network (CDN), and server response time directly affect how quickly content is delivered. Other common slowdowns include heavy use of JavaScript, unoptimized images, custom fonts, and too many plugins.
Regularly auditing and implementing website speed optimization techniques like optimizing your code and using a quality hosting service can help fix these issues.
- Google recommends keeping Time to First Byte (TTFB) at or below 0.8 seconds. TTFB measures how quickly a server responds to a browser request, and anything above 1.8 seconds is considered poor, often delaying key loading metrics like LCP and First Contentful Paint (FCP) (Google).
- Websites should target an Interaction to Next Paint (INP) of 200 milliseconds or less for good responsiveness. INP, which replaced First Input Delay (FID) as a Core Web Vital, measures how quickly a page responds visually after a user interaction, making it a key factor in delivering smooth experiences (web.dev).
- Around 40.3 million websites are using CDN. Without a CDN, visitors far from your origin server might experience delays from network latency. Your website is also more likely to slow down or crash under heavy traffic, since the origin must handle all requests (BuiltWith).
- Images account for 78% of a webpage’s total weight and remain the biggest performance bottleneck for most websites. On average, a single page contains 21 images totaling 1.9 MB a size larger than entire websites from just a few years ago (Dev).
- Large or complex fonts can slow website performance. Using web-optimized formats like WOFF or WOFF2, limiting font variations, or relying on system fonts as fallbacks can reduce file size and speed up loading times (Lenovo).
Tools to measure and improve website load time
Google PageSpeed Insights, GTmetrix, and Lighthouse are popular tools for assessing and reducing website load time. They analyze site performance by simulating how a browser loads your site, then evaluate issues based on key metrics like FCP, Time to Interactive (TTI), and overall page size.
These tools also check for best practices such as caching, reducing slow-loading resources, and optimizing images or scripts. That’s why using them regularly is essential for effective website optimization.
- GTmetrix Grade combines Performance (60%) and Structure (40%) scores into a letter grade between A and F. The Performance part measures real load metrics like LCP, FCP, and Speed Index, while the Structure score evaluates how well your page is built according to performance best practices (GTmetrix). Learn how to properly perform a website speed test with GTmetrix for optimal results.
- GTmetrix Performance Scores and Google PageSpeed Insights (PSI) scores are not directly comparable. While both are driven by Lighthouse, differences in test location, hardware, network conditions, and Google’s additional processing methods can cause slight variations in results (GTmetrix).
- PageSpeed Insights provides lab and field data to analyze website performance. Lab data is gathered in a controlled environment for testing and troubleshooting, while field data shows data collected from the real users visiting your site. Together, they show real-world page load speeds and provide daily updates to help monitor and improve performance (Chrome for Developers, web.dev).
- PSI classifies user experience into Good, Needs Improvement, or Poor based on Web Vitals thresholds. For example, LCP is rated “Good” if it occurs in 2.5 seconds or less, “Needs Improvement” between 2.5 and 4 seconds, and “Poor” if it exceeds 4 seconds (Chrome UX Report).
- 75th percentile metrics for Core Web Vitals performance assessment. If at least 75% of page views meet the “Good” threshold, a site is classified as performing well for that metric. For example, a site would be considered to have “Good” LCP if 75% of its visits had LCP under 2.5 seconds (web.dev).
Why does website speed matter?
Website speed plays an important role in user experience, SEO, and business performance. Google’s ranking algorithm includes Core Web Vitals like LCP and FID, which reflect how quickly users can see and interact with your content. Failing to meet its ranking standards can push your pages lower in search results.
For business owners, poor visibility means fewer eyes on your products, resulting in lower conversions and revenue. A slow website can also affect credibility, making your brand seem unprofessional or untrustworthy, especially for first-time visitors.
- Bounce rates can increase by 32% if load times reach three seconds. When load time increases from 1 to 5 seconds, bounce rates jump by 90%, showing how even small delays can significantly impact user retention (Google).
- A three-second wait can reduce customer satisfaction by around 16%. With 44% of online shoppers sharing bad experiences with friends, website speed is a key driver of perceived value and word-of-mouth reputation (Kissmetrics).
- A one-second delay in page response can cause a 7% reduction in conversions. For a site generating $100,000 per day, that delay could translate to about $2.5 million in lost revenue per year (Kissmetrics).
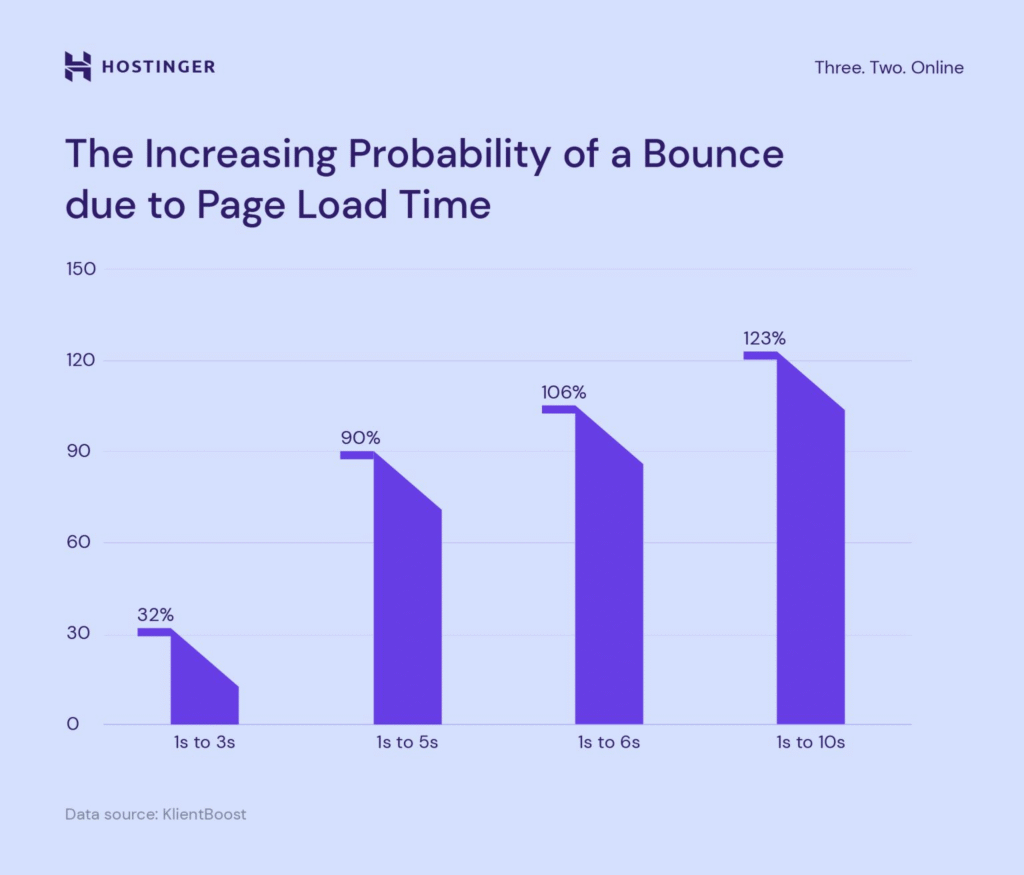
When it comes to website performance, every second counts in retaining potential customers, maximizing conversions, and building loyalty. Even a jump from 1 to 3 seconds raises bounce probability by 32%, while a 10-second load can more than double it. With users expecting instant responses and seamless browsing, optimizing website speed is no longer optional.
The future of website load time: What to expect beyond 2026
Website speed is a core driver of user satisfaction, search visibility, and business success. The data shows that users expect fast, seamless experiences, and even small delays can cause higher bounce rates, lost sales, and reduced trust.
Trends point to an increasingly competitive online environment, with both consumers and businesses placing greater emphasis on performance. From the growth of mobile commerce to case studies from leading brands, the message is clear: speed now determines whether users stay or leave.
However, speed is only part of the performance equation; website uptime matters just as much. A site that loads quickly but suffers frequent outages still risks losing users, while reliable uptime paired with fast loading builds confidence and encourages repeat visits. For businesses, maintaining both speed and stability is essential to protecting revenue and reputation in the long term.
Related digital performance statistics you need to know
Website speed is just one part of digital performance. To see the bigger picture, let’s explore key statistics across ecommerce, WordPress, web hosting, and landing pages. The following statistics show how performance influences engagement, conversions, and overall business success.
Why is load time crucial for ecommerce success?
In a competitive market, website speed can mean the difference between making or losing a sale. When shoppers experience delays, they’re more likely to leave and buy from a faster competitor. Fast load times not only keep users engaged and increase the chances of completing a purchase, but also build trust and encourage them to return.
- Around 70% of shoppers use smartphones for online purchases. Ecommerce statistics show that global mobile commerce is growing at a rate of 29%, making speed optimization key to delivering a smooth mobile experience and capturing this expanding market (Hostinger).
- Approximately 85.6% of users made a purchase online within the past month. This high frequency of online shopping means that slow performance can have an immediate and noticeable negative impact on sales (Hostinger).
- 58% of customers prioritize fast and reliable shipping. The same expectation for speed applies online, making fast load times an essential part of a positive brand experience (Hostinger).
- Vodafone boosted sales by 8% after improving LCP by 31%. The telecommunications company also saw an 11% improvement in its cart-to-visit rate, making it a strong case study of how prioritizing performance can provide a competitive edge (web.dev).
- BBC reported losing 10% of users for every additional second of load time. To avoid the costly impact of slow performance, the website now disables certain features during high-traffic periods to maintain speed and prevent user drop-off. This shows why businesses should never sacrifice speed for any reason (web.dev).
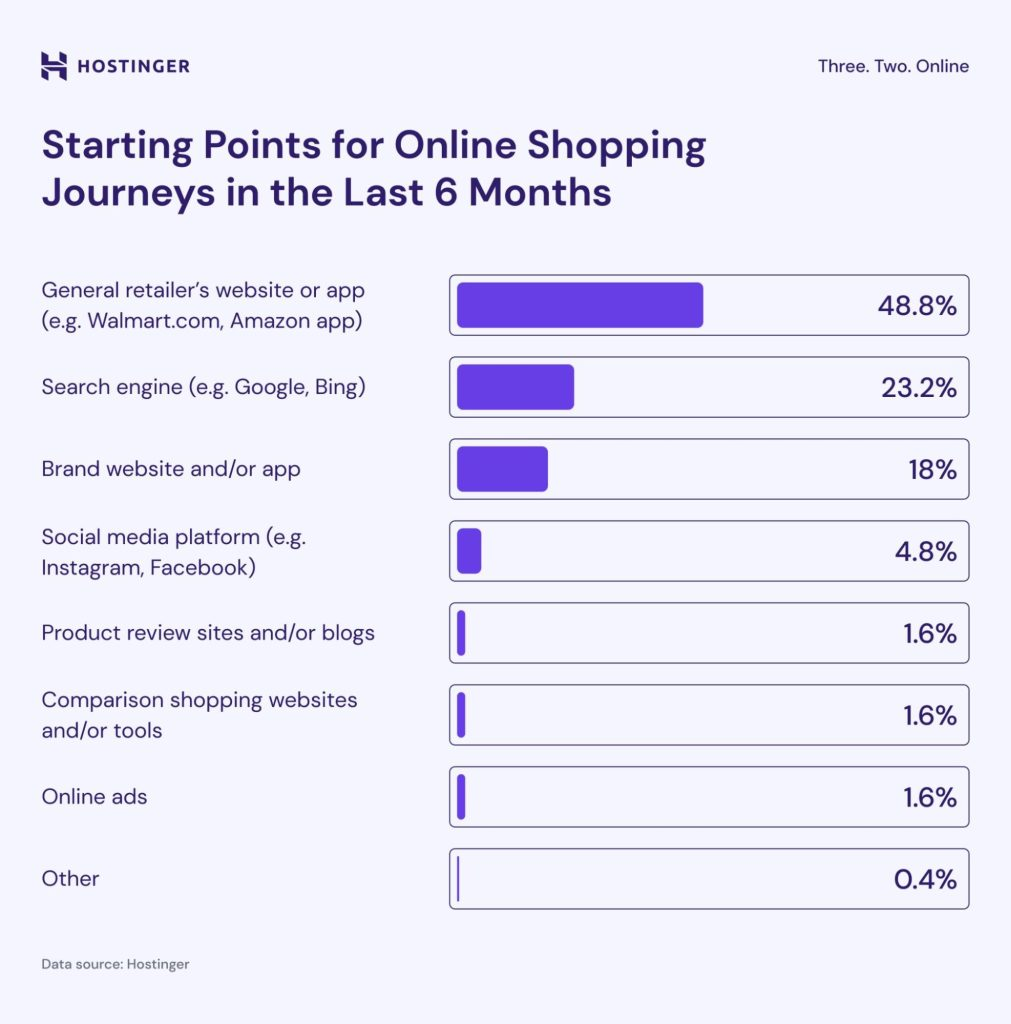
Nearly half of buyers begin and complete their purchase journey entirely on a retailer’s website or app, and 86% say they most frequently shop online on these platforms. This makes websites a crucial channel for reaching customers and driving sales.
As competition grows, optimizing for speed helps make a strong first impression and keep customers coming back with a frustration-free experience.
Website speed on WordPress: Themes, plugins, and load time
Powering over 43% of the internet, WordPress is the most widely used content management system (CMS) globally. It holds an estimated 61.3% share of all CMS-based sites, meaning performance issues on WordPress can impact a significant portion of the web.
As a self-hosted platform, its load time depends heavily on how each website is configured. Web hosting quality, the choice of plugins and themes, and optimization best practices all impact WordPress website speed.
- The average WordPress site loads in 2.5 seconds on desktop. WordPress statistics highlight it takes 13.25 seconds on mobile. Being 4.65 seconds slower than the overall average makes mobile performance optimization especially critical for websites built with this CMS (Hostinger).
- WordPress supports over 59,000 free plugins and 13,000 themes. These vary widely in coding efficiency, meaning your choice of plugins and themes can directly affect website speed (Hostinger).
- WooCommerce stores make up 9.1% of all ecommerce sites. The plugin powers over 4.6 million online stores, indicating the significance of its speed and performance in the ecommerce industry (Hostinger).
How does web hosting impact website load speed?
Web hosting affects website load speed by determining how quickly your server responds to visitors. If the server is slow or overloaded, your site’s content takes longer to load for users. Reliable hosting ensures faster response times, smoother performance, and a better overall experience.
The latest web hosting statistics highlight the importance of choosing a high-quality hosting provider for optimal website speed.
- The global web hosting market is set to hit $355.8 billion by 2025. This growth is driven by increasing demand for performance-focused hosting solutions (Hostinger).
- 47% of users expect a website to load in two seconds or less. Since web hosting plays a critical role in website performance, choosing a quality provider is key to creating a positive user experience and driving engagement (Hostinger).
- 9 in 10 enterprises adopt multi-cloud strategies to optimize cost and performance. Using multiple cloud providers helps businesses cut costs, improve performance, and avoid vendor lock-in. This flexibility lets them customize hosting for different workloads, regions, and user needs (Hostinger).
- Edge computing is transforming web hosting with low-latency performance. Processing data closer to users reduces latency and speeds up load times, making this approach ideal for applications needing real-time responses. The market is projected to reach $350 billion by 2027 (Hostinger).

Hostinger holds 4.1% of the global hosting market and powers 1.43% of the top one million websites. Recognized as one of the fastest-growing hosting providers, it has achieved over 50% growth in market share in the past year alone, driven by its affordable pricing, user-friendly interface, and reliable performance.
These factors position Hostinger as a trusted hosting solution for delivering speedy, consistent website performance.
How does landing page speed affect conversions?
As a standalone page designed to guide visitors toward a specific action, a landing page’s effectiveness depends heavily on how quickly it loads. A slow page can cause visitors to lose interest and leave before engaging, while a fast, smooth experience builds trust and keeps them focused on completing the desired action.
- The average landing page conversion rate is 4.3% across all industries. Landing page statistics show restaurant and catering, along with media and entertainment, lead with median conversion rates of 9.8% and 7.9% respectively, making website performance and speed especially important in these sectors (Hostinger).
- Simpler landing pages with clear calls to action can boost conversions by 13.5%. Keeping them straightforward not only improves clarity but can also enhance performance (Hostinger).
- Only one in eight A/B tests produces a statistically significant difference. This highlights the importance of maintaining speed as a stable baseline for optimization (Hostinger).
- Improved UX design can increase conversion rates by up to 400%. Speed is among key factors that help achieve this, removing obstacles that might prevent users from completing a purchase (Hostinger).
All of the tutorial content on this website is subject to Hostinger's rigorous editorial standards and values.

Jordana is a Senior Content Writer with a background in Information Systems. She has over five years of experience in WordPress and is casually dabbling with PHP and MySQL. Her passion for writing and technology drives her to create tutorials for anyone wanting to build their online presence. Follow her on LinkedIn.