eCommerce statistics 2024: key findings and shopping trends [latest research]
![eCommerce statistics 2024: key findings and shopping trends [latest research]](https://www.hostinger.com/tutorials/wp-content/uploads/sites/2/2022/01/ecommerce-statistics.png)
If you’re still on the fence about starting an eCommerce business, now is the time to fully commit. With online shopping showing no signs of slowing down, it’s still one of the best ways to make money online today.
Having quality products and strong branding is only half the battle. To navigate your business better, it’s important to stay updated on the latest eCommerce statistics and understand the current market landscape.
In this article, we highlight key findings from our recent study, along with insights from other trusted resources. We’ve gathered 39 essential eCommerce statistics on trends, online shopping behaviors, and new market opportunities to help you make well-informed decisions for your business.
2024 eCommerce statistics: key findings
Here are the top seven eCommerce statistics from our study that illustrate the current state of the industry:
- Over a third of customers spent less than $200 on online purchases.
- 49% of customers start and end their shopping journeys on retailer websites or apps.
- Over half of customers prioritize fast and reliable shipping.
- 47% of customers seek assistance via live chat.
- Smartphones are the top choice for online shopping among 70% of shoppers.
- High prices are the top reason for cart abandonment, affecting 45% of Gen Z, 34% of Millenials, and 32% of Gen X and Boomers.
- 24% of online shopping happens during the holiday season.
1. Most people shop online monthly
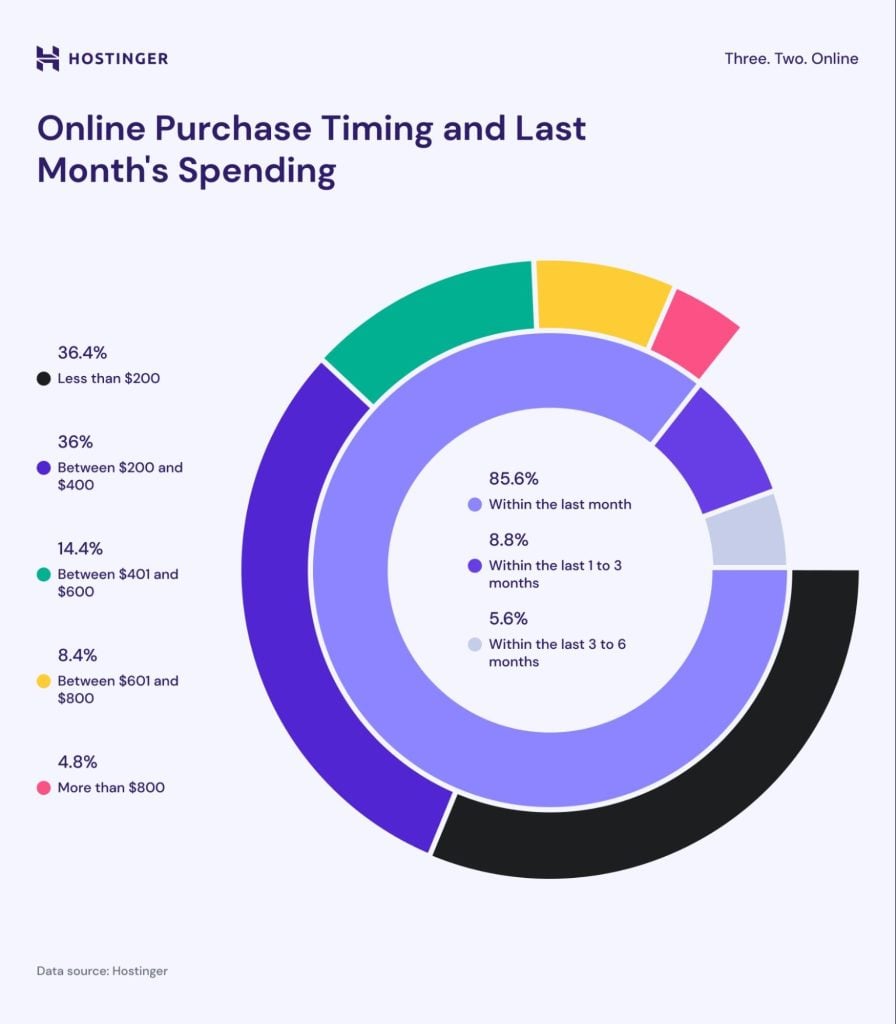
One of the most obvious eCommerce trends is that almost everyone shops online frequently. About 85.6% of people made an online purchase within the last month, while 8.8% did so in the past 1-3 months. Only 5.6% purchased within the last 3-6 months.
Many shoppers are also willing to spend a good amount each month. In the last month, 36.4% of customers spent less than $200 on online purchases, while 36% spent between $200-400. Around 23% of customers spent between $401-800, while only 4.8% went beyond $800.
You can take advantage of the high demand for online shopping by providing a range of products and price options to accommodate different spending levels.
2. Nearly half of customer journeys start and end on retailer websites or apps
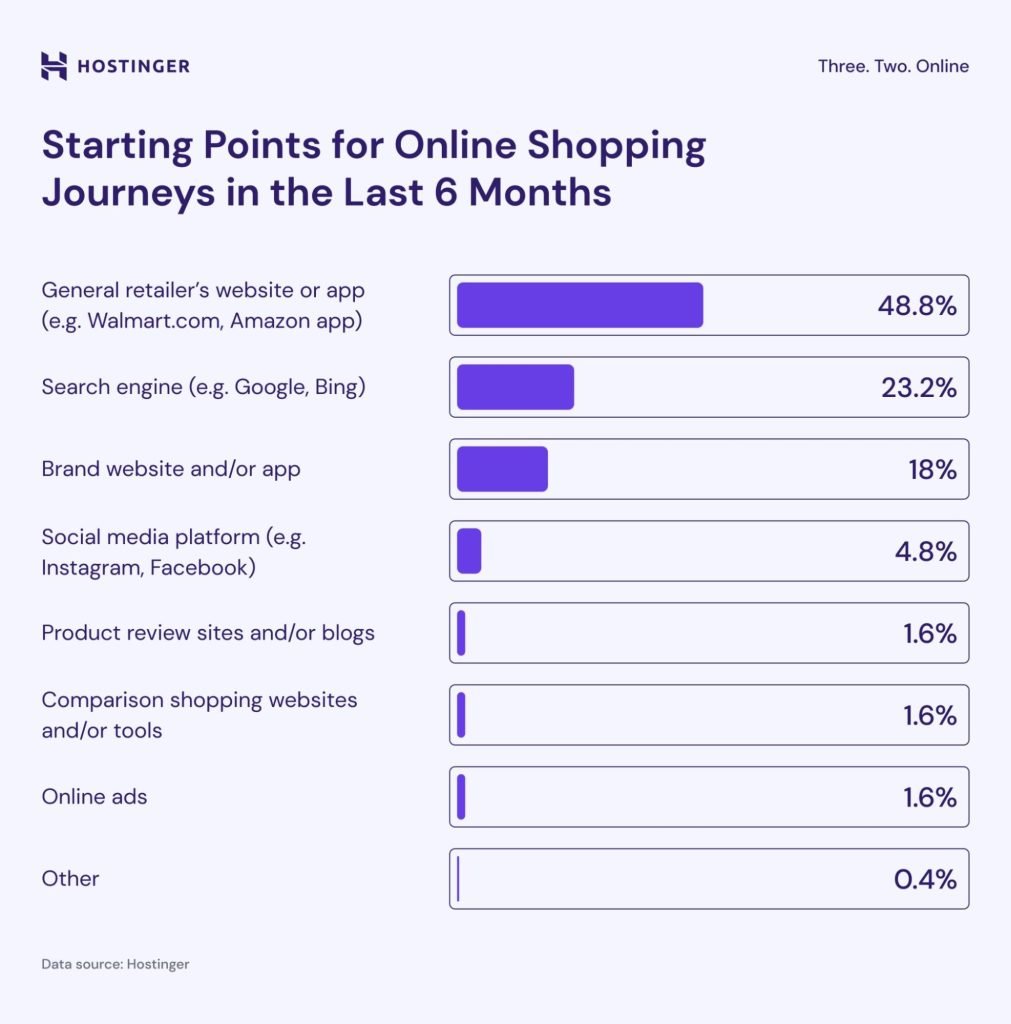
Between early and mid-2024, 48.8% of customers started shopping on general retailer websites or apps like Walmart or Amazon. 86% said they most frequently make their online purchases through these platforms.
Search engines like Google or Bing were the second most popular starting point, with 23.2% of customers using them.
Around 18% of customers directly went to the brand’s website or app, while 4.8% started on social media platforms like Instagram or Facebook. The other 5.2% came from product review sites, price comparison tools, online ads, or other channels.
These findings suggest that sellers are more likely to get sales on retailer platforms. The competition on these platforms may be fierce, but their large customer base offers a huge advantage for small online businesses that are still building their online presence.
3. Most shoppers focus on shipping, security, and price
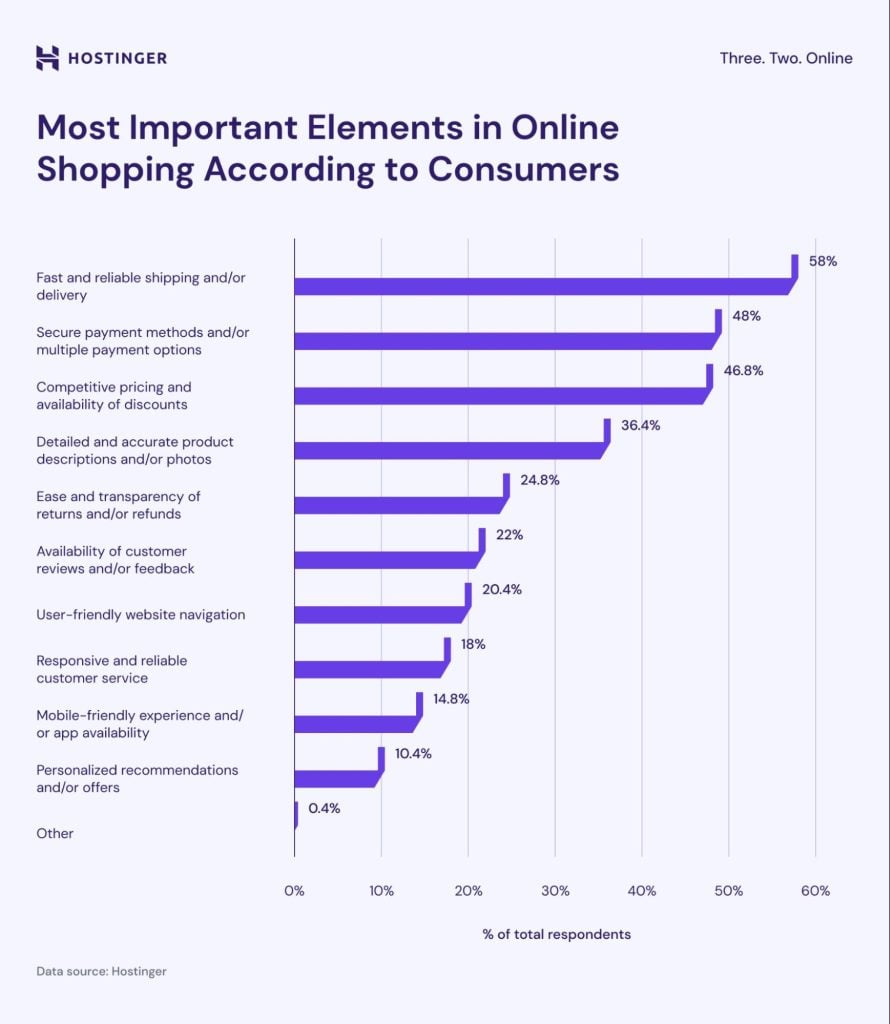
Fast and reliable shipping is the most important factor for 58% of shoppers. Meanwhile, 48% value secure payment methods and multiple payment options the most, followed by 46.8% who prioritize competitive pricing and discounts.
36.4% of buyers want accurate product descriptions and photos to prove transparency and accountability, while 24.8% expect a simple and transparent return or refund process.
Other crucial factors in online shopping include user-friendly website navigation (20.4%), responsive customer service (18%), mobile-friendly experience (14.8%), and personalized offers (10.4%).
To satisfy customers and maximize your sales, keep these key preferences in mind when running your business.
4. Live chat dominates customer support preferences at 47%
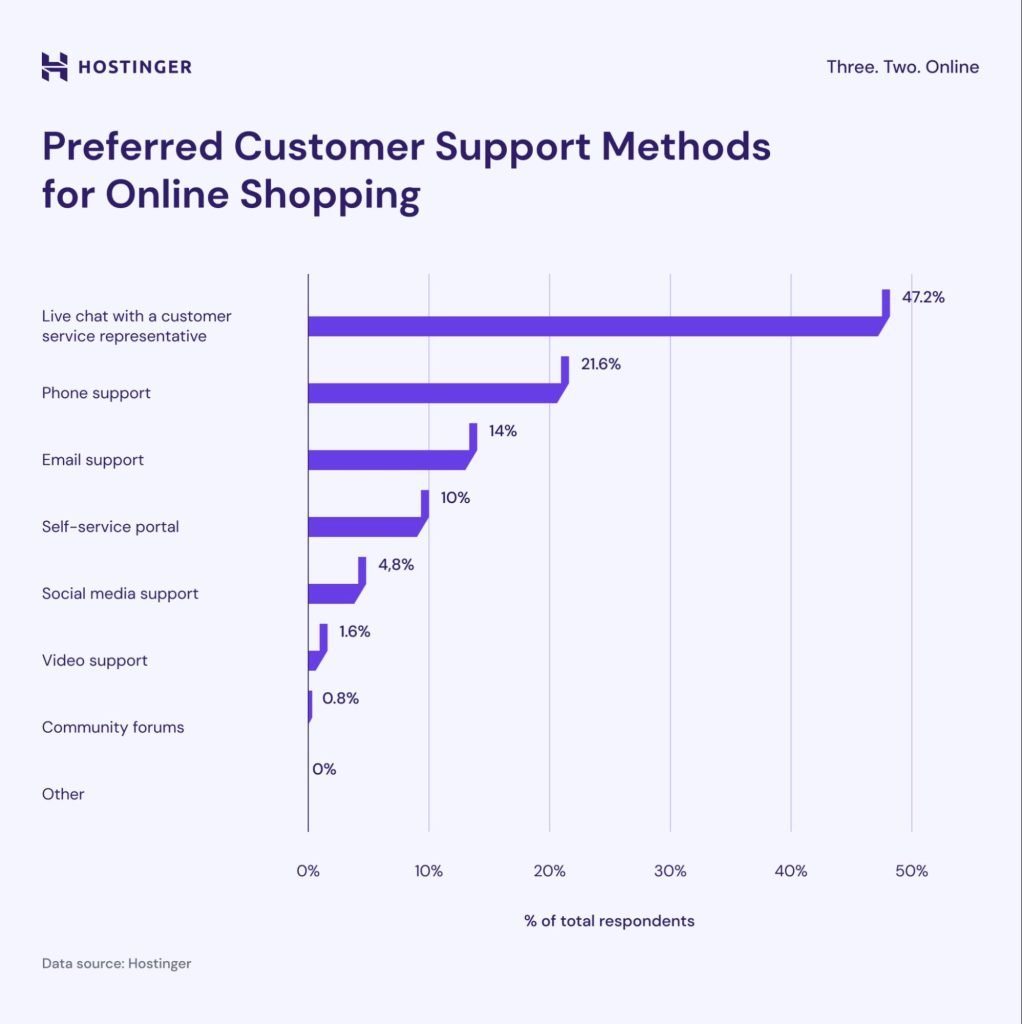
Nearly half of customers (47.2%) prefer using live chat to get help from a customer service representative. Phone support is the second most popular option but less preferred, with 21.6% choosing it.
Around 14% of shoppers choose email support, followed by a self-service portal (10%) and social media support (4.8%). Other options, like video support and community forums, make up only 2.4%.
Our study also found that men are more likely to prefer email support, with 16% choosing it compared to 12% of women. Similarly, 24% of men rely on phone support more often than 20% of women.
If your online store doesn’t have live chat support yet, consider adding it to improve its customer experience.
5. Online shopping peaks in the afternoons and evenings
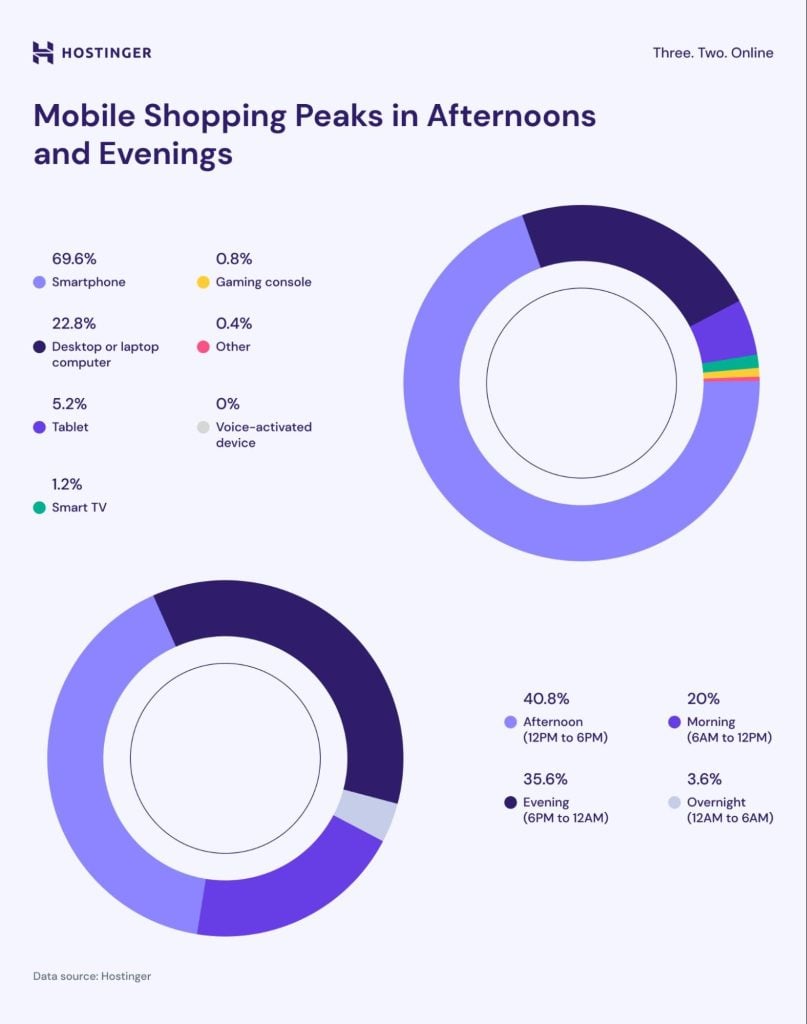
A whopping 69.6% of shoppers prefer using their smartphones for online purchases, while only 22.8% use a desktop or laptop computer. The other 7.6% make purchases using other devices like tablets, smart TVs, gaming consoles, or voice-activated devices like Amazon Echo or Google Home.
As for the preferred time of day, our study showed that afternoons and evenings are the most popular. Around 40.8% of customers make online purchases in the afternoon (12 PM to 6 PM), while 35.6% prefer shopping in the evening (6 PM to 12 AM). Mornings (6 AM to 12 PM) see 20% of online shopping activity, and only 3.6% shop overnight (12 AM to 6 AM).
To improve sales and customer experience, make sure to optimize your online store for mobile users and try launching new products in the afternoon or evening.
6. High prices are the main cause of cart abandonment
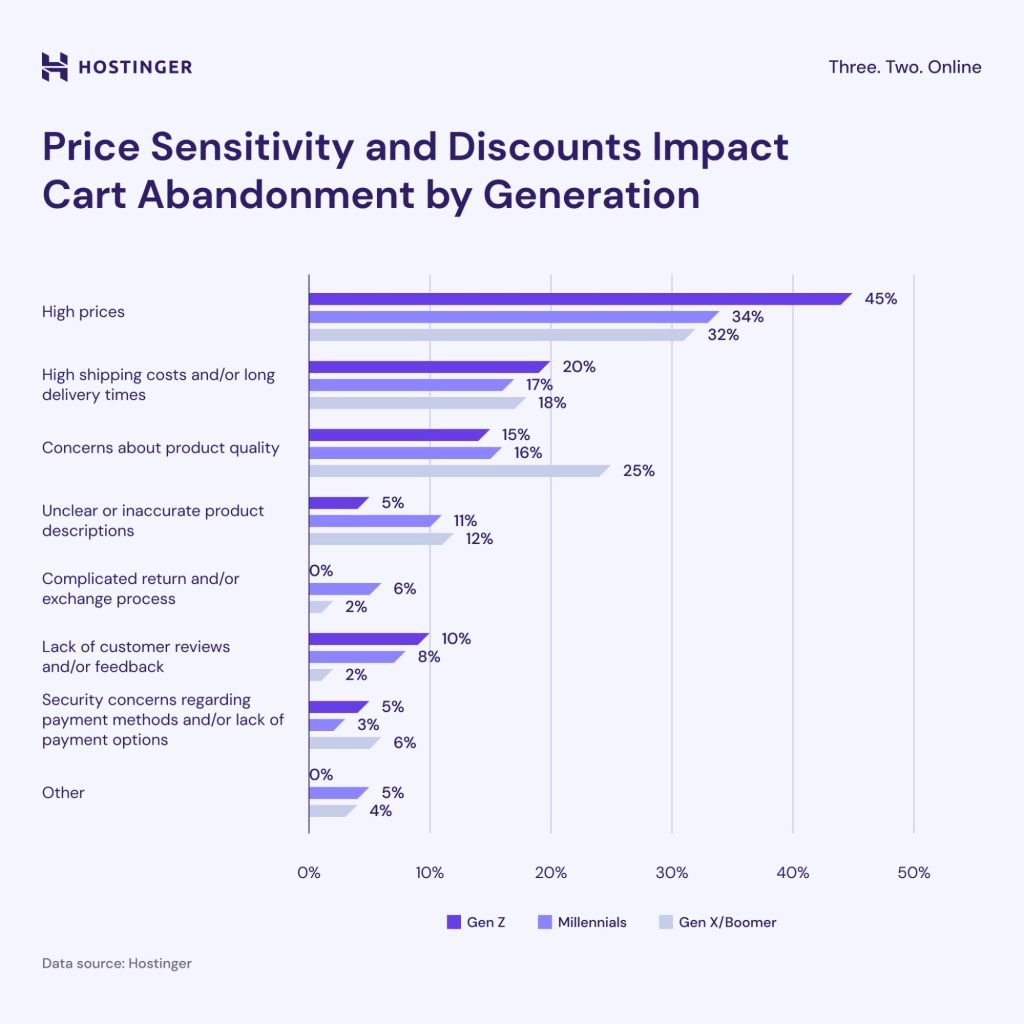
45% of Gen Z shoppers said that high prices are the main reason for abandoning their carts. The same goes for 34% of Millennials and 32% of Gen X and Boomers.
High shipping costs and long delivery times are the second most common causes for 20% of Gen Z, 17% of Millennials, and 18% of Gen X and Boomers.
Concerns about product quality also play a significant role, especially for older customers. Around 25% of Gen X and Boomers list them as a reason for abandoning their carts, compared to 16% of Millennials and 15% of Gen Z.
Unclear or inaccurate product descriptions are also a bigger deal for Gen Xers and Boomers compared to the younger generations.
Other reasons for cart abandonment are a lack of customer reviews, complicated return processes, and security concerns.
To reduce cart abandonment, offer competitive pricing, reasonable shipping costs, and detailed product descriptions. These can significantly improve the shopping experience and boost sales.
7. The holiday season drives 24% of online shopping activity
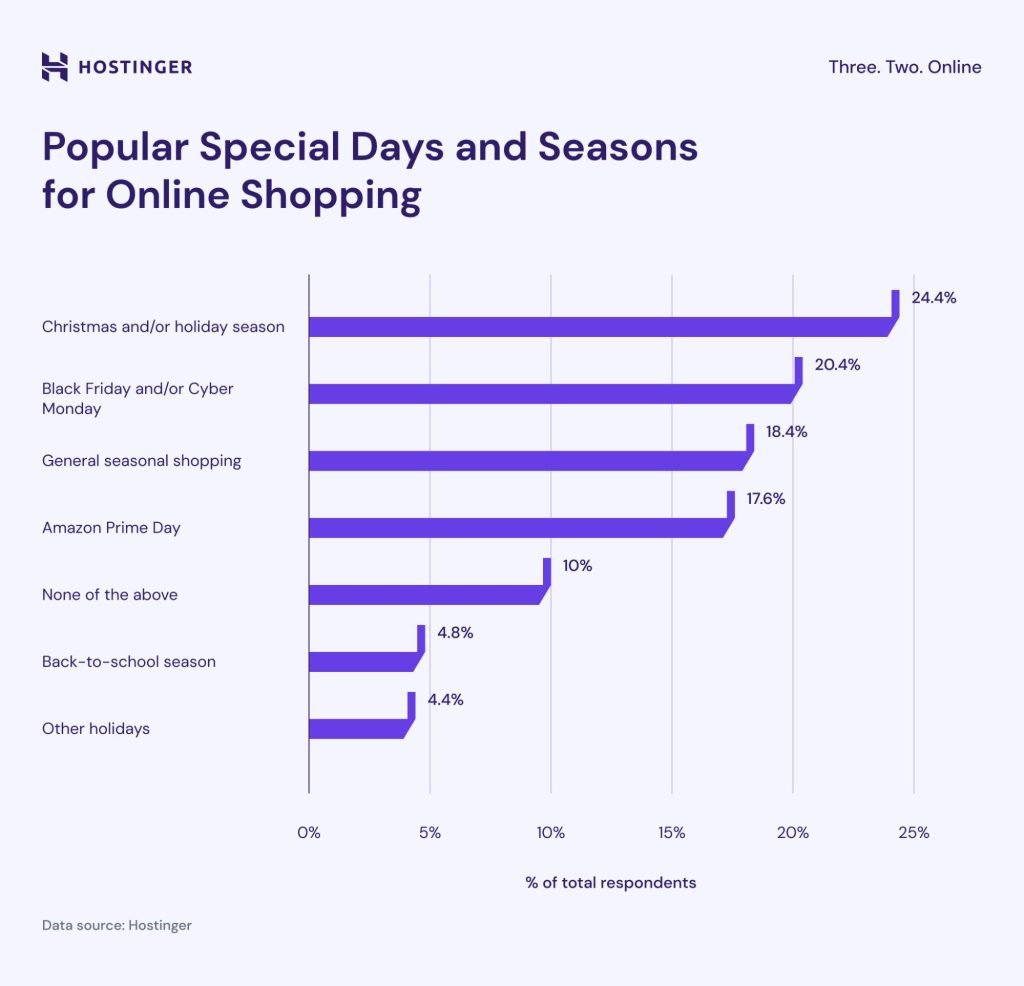
The holiday season, especially Christmas, sees the highest online shopping activity at 24.4%. This trend applies to both men and women, who are almost equally likely to shop online during this time.
Black Friday and Cyber Monday are the second most popular special events, encouraging 20.4% of people to shop. Interestingly, men (25%) are more likely to shop during these events than women (17%).
Other popular shopping periods include Amazon Prime Day and general seasonal shopping, each attracting 17.6% of customers. The back-to-school season accounts for 4.8% of online shopping activity, while other holidays like Valentine’s Day, Labor Day, and Halloween contribute 4.4%.
However, 10% said that none of these special events affect their online shopping behavior.
Consider taking advantage of these festivities to drive seasonal sales. Hostinger, for instance, offers Black Friday web hosting deals to attract new customers.
eCommerce growth statistics
This section covers global eCommerce growth projections and retail sales data to help with business decision-making. These eCommerce statistics are relevant for all online retailers, regardless of location.
8. eCommerce sales could reach 23% of retail sales worldwide in 2027
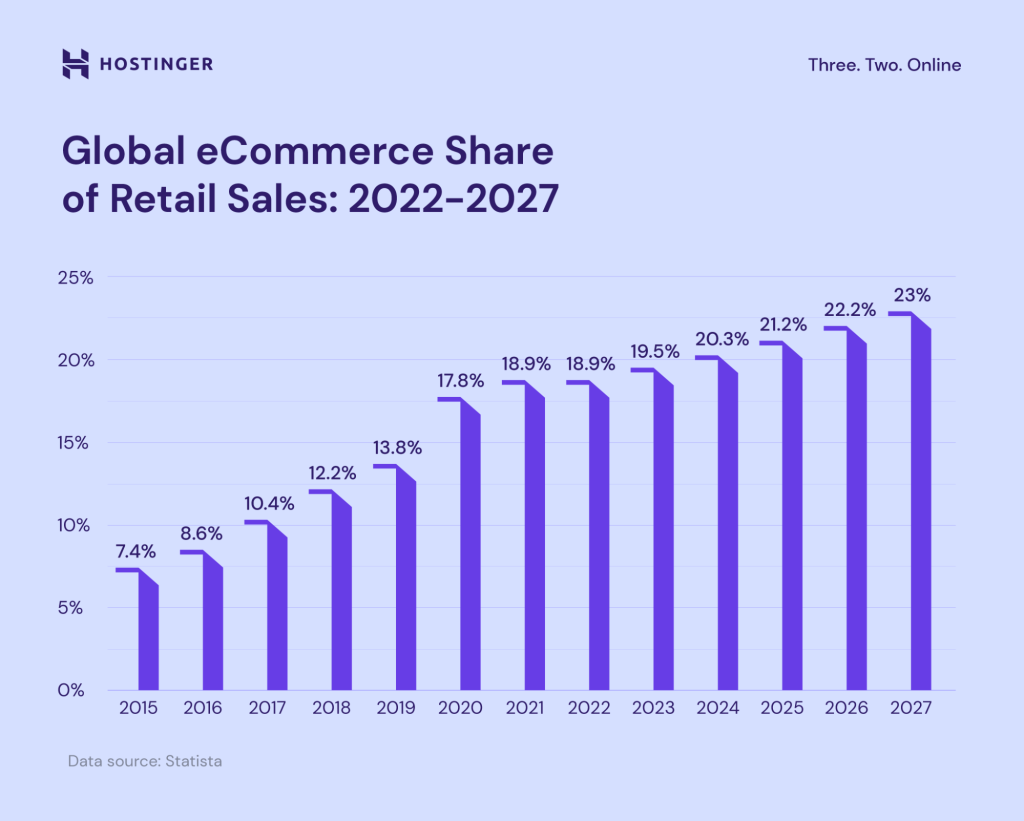
In 2023, eCommerce made up 19.5% of global retail sales. Forecasts suggest that online sales will account for nearly a quarter of global retail sales by 2027.
Improved online access and digital development fueled rapid growth in global eCommerce sales. With mobile commerce thriving, especially in Asia, we can anticipate an uptrend in the coming years.
9. Global eCommerce revenue to exceed $6.4 Trillion by 2029
Global eCommerce revenue is projected to exceed $6.4 trillion by 2029, with an annual growth rate (CAGR) of 9.49% from 2024 to 2029. This growth is consistent with the continued rise of online shopping worldwide.
By 2029, the average revenue per user (ARPU) in the eCommerce market is expected to reach $1,620, highlighting the rising spending power of online shoppers.
10. U.S. retail eCommerce sales reached $271.7 billion in Q3 2023
The U.S. eCommerce market is projected to experience an 11.2% growth from 2023 to 2027, while Europe is expected to see a 9.3% increase. This is significantly higher than the global average growth rate of 0.7%.
Meanwhile, fast-growing eCommerce markets are concentrated in Asia. The Philippines and India are expected to lead, each projecting over 20% growth in online sales.
11. Around 2.77 billion people expected to shop online by 2025
As of September 2024, 2.71 billion people were shopping online. In a global population of 8 billion, about 34% of people worldwide use online shopping to meet their needs, marking a 2.7% increase from the previous year.
eCommerce user penetration is expected to hit 49.1% by 2029, meaning around 3.9 billion people could shop online in the next five years.
Based on these eCommerce statistics, entering the industry now could give your brand a head start in reaching a wider audience.
Consumer behavior trends
Understanding customers’ shopping habits can help you fine-tune your online store’s user experience for more sales and stronger customer loyalty. It’s crucial for any eCommerce strategy, regardless of niche.
12. Nearly half of Gen Z shoppers are prone to making last-minute purchases
Based on our study, 45% of Gen Z shoppers made 1-2 urgent or last-minute purchases in the last six months, while 30% completed 3-5. Millennials show similar behavior, with 44% making 1-2 last-minute purchases and 30% completing 3-5.
In contrast, Gen X and Boomer shoppers are less likely to make last-minute purchases. 40% reported making no last-minute purchases, and 34% made only 1-2.
Overall, 40% of all shoppers made 1-2 urgent purchases during this period, while 26% completed none. About 24% made 3-5 last-minute purchases, and 6% made 6-10. Only 5% more than 10 urgent purchases.
13. Nearly two-thirds of consumers shop online weekly
Our study showed that 62% of customers shop online once a week, and 29% do it 2-3 times weekly. This shopping behavior is similar for both men and women. Of those who shop online only once a week, 66% come from households with an income of less than $75,000/year.
Only 1% of these households spent more than $800 on monthly online purchases, compared to 11% of households with an income of $75,000/year or more.
14. Personal care leads top consumer purchases at 66%
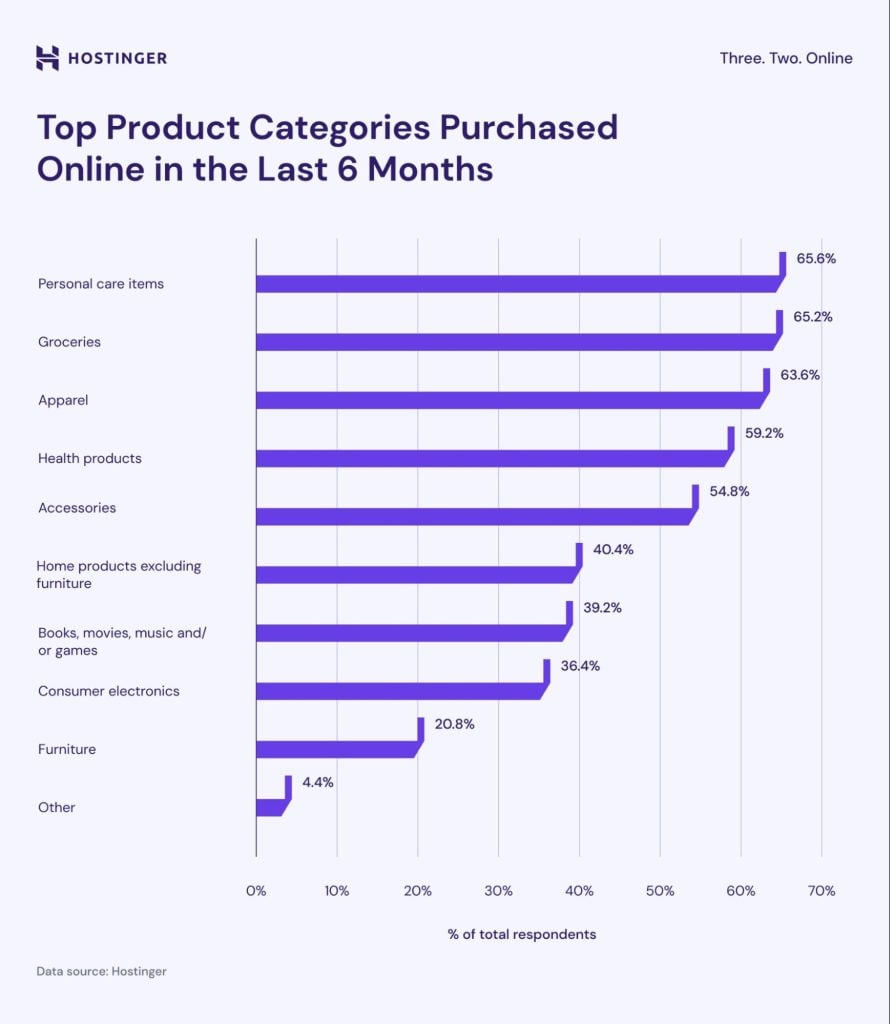
Personal care items like skincare, makeup, and hair products lead the list of top purchases, with 65.6% of customers buying them online in the last six months. Groceries and apparel follow closely at 65.2% and 63.6%, respectively.
59.2% of customers completed purchases for health products, such as vitamins and supplements. 54.8% spent on accessories like shoes and purses, while 40.4% bought home products.
Consumer electronics, such as TVs and computers, accounted for 36.4% of purchases, while books, movies, music, and games contributed 39.2%.
Furniture had a lower demand, with only 20.8% buying these items online. Finally, about 4.4% of respondents reported purchasing other items like pet supplies, outdoor lawn products, and auto parts.
Consider focusing on high-demand categories to build your customer base and boost sales.
15. Most consumers read online reviews before purchasing
Nine out of ten consumers rely on online reviews for buying decisions. Around 54.7% of consumers read at least four online reviews before buying a product, while 44% read up to three reviews. When sharing their experiences, 74% prefer posting reviews online.
97% of buyers who read reviews look for responses from online stores, so responding to customer reviews can create a positive impression. Most importantly, quickly addressing negative reviews can prevent them from spiraling out of control.
16. Google is the go-to platform for online reviews
59% of online shoppers use Google to find reviews, followed by Amazon with 57%. Even when shopping in-store, 72% of consumers use their mobile devices to check online reviews.
For this reason, 62% of consumers avoid brands that censor online reviews. Many of them are also good at spotting fake reviews. If a review lacks detail or seems overly positive or negative, people are more likely to deem it fake.
Since online consumers rely on Google My Business for local reviews, list your business on the platform if you haven’t.
17. One in three online shoppers prioritize sustainable brands
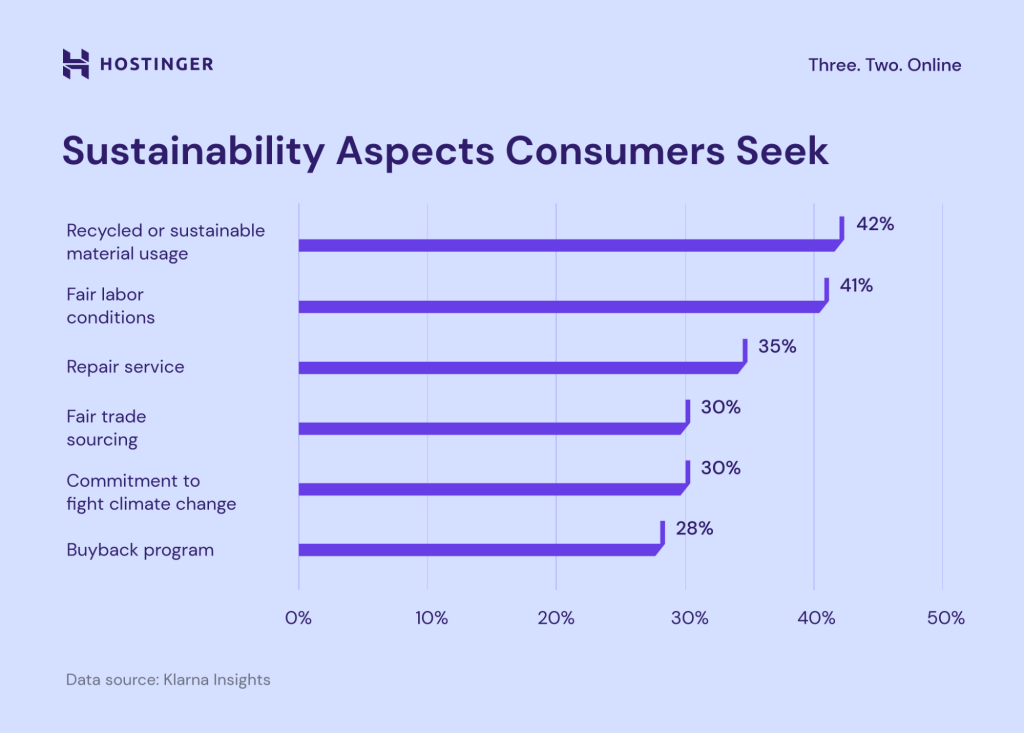
42% of consumers say sustainable materials are the most important aspect of sustainability, followed by fair labor conditions at 41% and repair services at 35%. It’s especially apparent in the apparel sector, where 50% of online shoppers seek sustainable options when buying clothing and shoes.
Sustainability is a significant deciding factor for Millennial and Gen Z consumers. They are 27% more likely to buy from brands that prioritize environmental and humanitarian impact than older generations.
Interestingly, men are more likely to value an online store’s support for local and small businesses (18%) than women (8%). However, women tend to prioritize sustainability practices (19%) more than men (13%).
It’s no surprise that brands focusing on environmental, social, and governance (ESG) initiatives saw an average of 28% growth, while those without only grew by 20%.
18. Consumers prefer online shopping to in-store shopping
24/7 availability, convenience, and discount deals make online shopping the go-to choice for 56.6% of consumers. That said, 44.4% still prefer in-store shopping, valuing the hands-on experience and ability to see, touch, and test products before buying.
If you have the resources, consider adopting a multichannel business model to cater to both customer preferences.
Mobile commerce statistics
The thriving mobile commerce market makes it easy for people to shop online using only their phones. It’s important to keep up with mobile shopping trends to boost sales via mobile websites and apps.
Here are the top seven eCommerce statistics for mobile commerce and how to leverage them for sales and conversions.
19. Women are more likely to shop on their phones
75% of female shoppers prefer to use mobile devices to make purchases compared to 63% of men. Men are more likely to shop on their computers (29%) than women (18%).
If your online business targets female customers, focusing on mobile marketing campaigns during peak shopping times can help improve sales and engagement.
20. Worldwide smartphone users are still increasing
Global smartphone users are projected to exceed 7.1 billion in 2024, a significant increase from the previous year’s 3.1 billion.
China has the highest number of smartphone users at 975 million, while the U.S. records the highest smartphone penetration rate at 81.6%.
The time spent on smartphones has also gone up over the past decade. In 2023, global internet users spent 57.6% of their time browsing on mobile phones, a 0.6% rise from 2022.
To convert this growing segment of smartphone users into customers, make sure your website is fully optimized for mobile devices.
21. Global mobile commerce will account for 62% of digital sales by 2027
The booming mobile usage fuels global mobile commerce market growth in 2023. It dominated 60% of all eCommerce sectors with $2.2 trillion in sales. With this uptrend, mobile commerce sales are projected to exceed $3.4 trillion by 2027.
To keep up with evolving consumer behavior, online stores must prioritize mobile optimization in mobile-first markets. Start by creating a user-friendly customer journey, from browsing to purchasing products.
22. Mobile commerce is growing 29% faster than traditional eCommerce
Global mobile commerce is growing at a rate of 29%, capturing 7% more completed payments than traditional eCommerce.
Around 70% of shoppers say mobile commerce is time-saving and convenient for buying on the go. However, issues like small page elements, security concerns, and interruptions from other apps can damage the experience.
Address these concerns with responsive design, security measures, and optimized load times to maintain a smooth browsing experience.
23. U.S. retail mobile commerce sales are expected to reach $710 billion by 2025
The U.S. mobile commerce sector shows consistent growth. From $220 billion in 2019, it has increased significantly year over year, reaching $511 billion in 2023.
With the growth forecasted to reach $604 billion in 2024, this signals a rising preference for mobile shopping in the country.
24. Voice shopping contributes $2 billion in consumer spending
The accessibility of mobile devices has boosted global voice commerce. People increasingly rely on voice assistants, which allow them to operate mobile devices without typing.
In 2023, voice commerce saw a $19.4 billion surge in transaction value, demonstrating a 400% growth in just two years. Projections are confident the industry will grow by 54.63% this year, surpassing $30 billion.
As 71% of consumers prefer voice search over text, eCommerce businesses should optimize their stores for voice-based shopping experiences.
25. Digital wallets expected to dominate 61% of global eCommerce payments by 2026
In 2023, digital wallets made up half of all online transactions worldwide. This payment method was highly favored in the Asia Pacific, accounting for about 60% of eCommerce transactions.
On the other hand, other payment methods might see a decline in the coming years. Despite being popular among U.K. and U.S. consumers, debit and credit card market shares in online transactions are expected to lose up to 7% of their market share by 2027.
Consider integrating popular digital wallets in your region into your online store to meet the increasing demand.
Key factors and challenges in online shopping decisions
Let’s dive into key factors that affect customers’ online shopping decisions and the challenges they face. If your online store is seeing a lot of cart abandonment, these insights can help you figure out why and offer some tips to turn things around.
26. Promotions and discounts drive 54% of online purchase decisions in the last 6 months
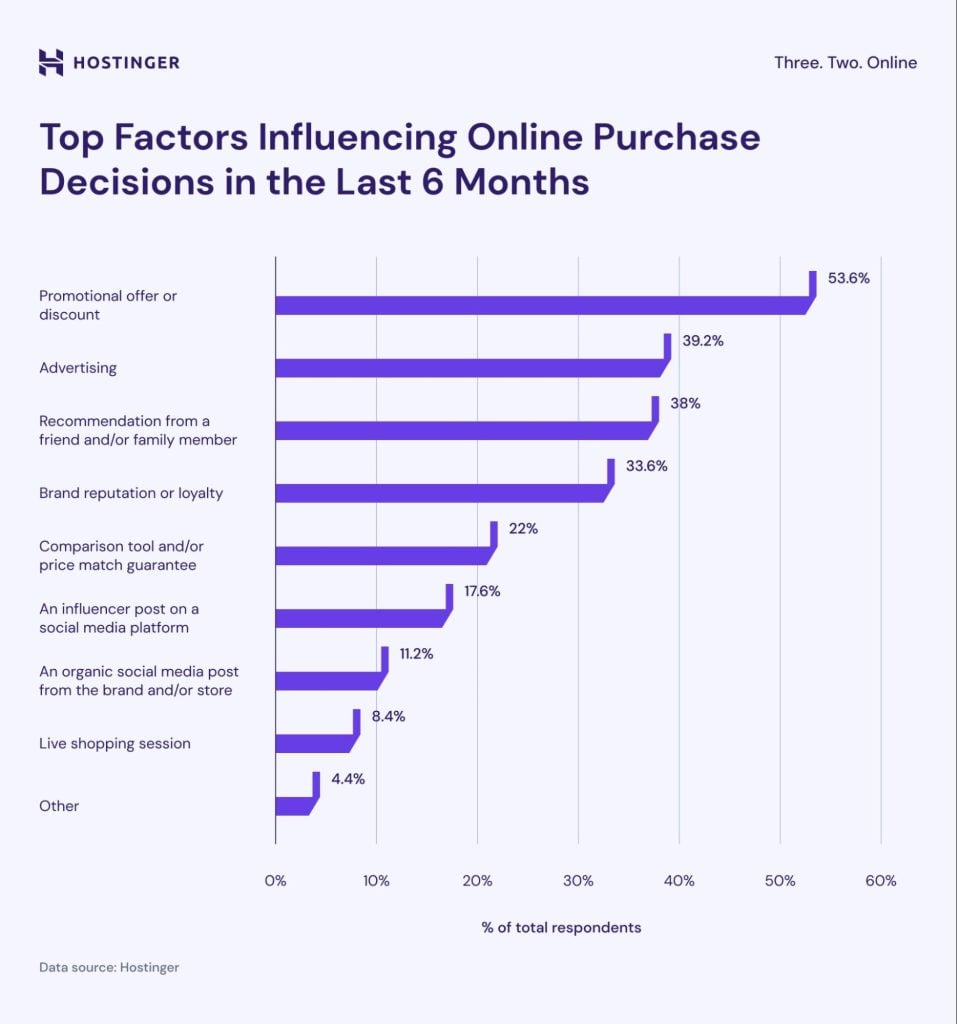
Between early and mid-2024, promotions and discounts were the top reasons people shopped online, influencing 53.6% of shoppers. Advertising, like social media or TV ads, influenced 39.2% of buyers, while recommendations from friends or family affected 38%. Brand reputation or loyalty was important for 33.6%.
Other factors included price comparison tools and price match guarantees, which impacted 22% of shoppers. Social media posts by influencers affected 17.6%, while organic posts from brands influenced 11.2%.
Live shopping sessions were less popular, impacting only 8.4% of buyers. Meanwhile, 4.4% mentioned personal reasons, such as needing a product or preferring to shop from home.
27. Lower prices attract online shoppers to buy directly from brands
Around 53% of consumers prefer buying online directly from brands for lower prices. Free delivery and fast shipping also significantly influence their purchasing decisions.
Only 16% of consumers consider personalized products a strong motivator for direct brand purchases, making it the least influential factor.
Take advantage of this consumer behavior insight to increase sales by featuring online-exclusive deals. To encourage more purchases, offer free shipping options or set a minimum purchase amount for free deliveries.
28. Live chat support encourages 38% of customers to buy
Live chat can enhance brand loyalty, with 51% of consumers more likely to make repeat purchases on retail websites that offer it. Since half of the global population uses mobile devices, it’s no surprise that 62% of digital buyers expect a mobile-friendly live chat.
Besides accessibility, live chat support should also excel in speed and quality. Poor user experience, scripted responses, and long wait times frustrate users the most. Invest in a knowledgeable support team for personalized expert assistance.
29. Better prices elsewhere lead 26% of shoppers to abandon their online carts
We’ve found that high prices are a major challenge when shopping online, so it’s no surprise that 26% of shoppers abandoned their carts to find a better price elsewhere. Close behind, 23% simply changed their minds before completing the transaction.
Unexpected or high fees or taxes deterred 16% of shoppers from purchasing, while 14% decided to wait for a sale or discount. Meanwhile, indecisiveness or a change in mood accounted for 14% of abandoned carts.
Other reasons for leaving carts include a lengthy or complicated checkout process (4%) and concerns about payment security (3%).
30. Shipping costs concern men, while unclear or inaccurate product descriptions put off women
High shipping costs and long delivery times are a bigger concern for men, with 59% finding them problematic compared to 41% of women. Similarly, a lack of customer reviews is more of an issue for 54% of men than 46% of women.
On the other hand, women tend to worry about product quality, with 58% citing it as a challenge, compared to 42% of men. High prices and unclear or inaccurate product descriptions are also bigger issues for women, affecting 60% and 63%, respectively.
eCommerce marketing statistics
Creating effective marketing campaigns is crucial to staying relevant in the competitive eCommerce market. The following insights on digital marketing trends can help you make informed choices for ads and strategies for more impactful conversions.
31. Loyalty programs influence 83% of consumers to repurchase
Loyalty programs are effective for boosting conversions and retaining customers. With an annual revenue growth of 12-18%, it’s no wonder that 80% of loyalty program owners plan to increase their investments in this strategy.
Cashbacks, exclusive perks, and personalized offers are the top benefits that encourage sign-ups.
Moreover, six out of ten consumers in loyalty programs have better brand experiences, so this marketing strategy is a win-win for both businesses and customers.
32. eCommerce companies are investing in personalized email marketing
We can expect 55% of email marketers to focus on personalization for higher engagement rates until mid-2025. Meanwhile, almost half of them want to automate more parts of their email marketing to make it run smoother.
Besides personalizing the email body, using a preheader to summarize the content also helps increase open and click-through rates. Plus, emails with personalized subject lines get better engagement rates.
33. Almost all businesses use video marketing
In 2023, a staggering 91% of businesses used video as a marketing tool, a 5% increase from the previous year. 68% of businesses that haven’t tapped into video marketing also plan to use it in 2024.
Almost half of marketers choose live-action videos, followed by animated and screen-recorded videos. Companies often use it for testimonials, product demos, presentations, and social media content.
34. Videos convince 82% of consumers to make purchases
Video marketing benefits consumers just as much as online businesses. A whopping 91% of consumers have watched videos to learn about products or services, which influence their buying decisions.
It’s great to see more brands embracing video marketing. After all, 89% of consumers want to see more videos from them. To maintain customer attention and trust, make sure to produce useful, informative videos with high production value.
35. One out of three small businesses don’t have a website
Creating a website is now easier than ever. However, 29% of small businesses choose not to create an online store, with one-third preferring social media to sell online.
This highlights the importance of measuring success through conversion rates on different platforms. It helps businesses measure the effectiveness of their online marketing, whether on an online store or a social media page.
To calculate the conversion rate, divide the number of successful transactions by the total number of website or social media profile visitors and multiply the result by 100 to get the percentage.
However, with the 2023 eCommerce conversion rate averaging 2.27%, businesses with no websites may miss out on two to three transactions for every 100 visits.
Build a Successful Small Business
Check out the latest small business statistics for valuable insights to kickstart your eCommerce business venture.
Social media statistics for eCommerce
Did you know that social media users are expected to hit over 6 billion by 2028? No wonder social media is one of the go-to channels for online marketing. Understanding how your target audience uses social media helps you tailor your marketing campaign to their preferences for better results.
Check out the latest social commerce statistics to grow your online business.
36. Global social commerce market set to generate $8.5 trillion by 2030
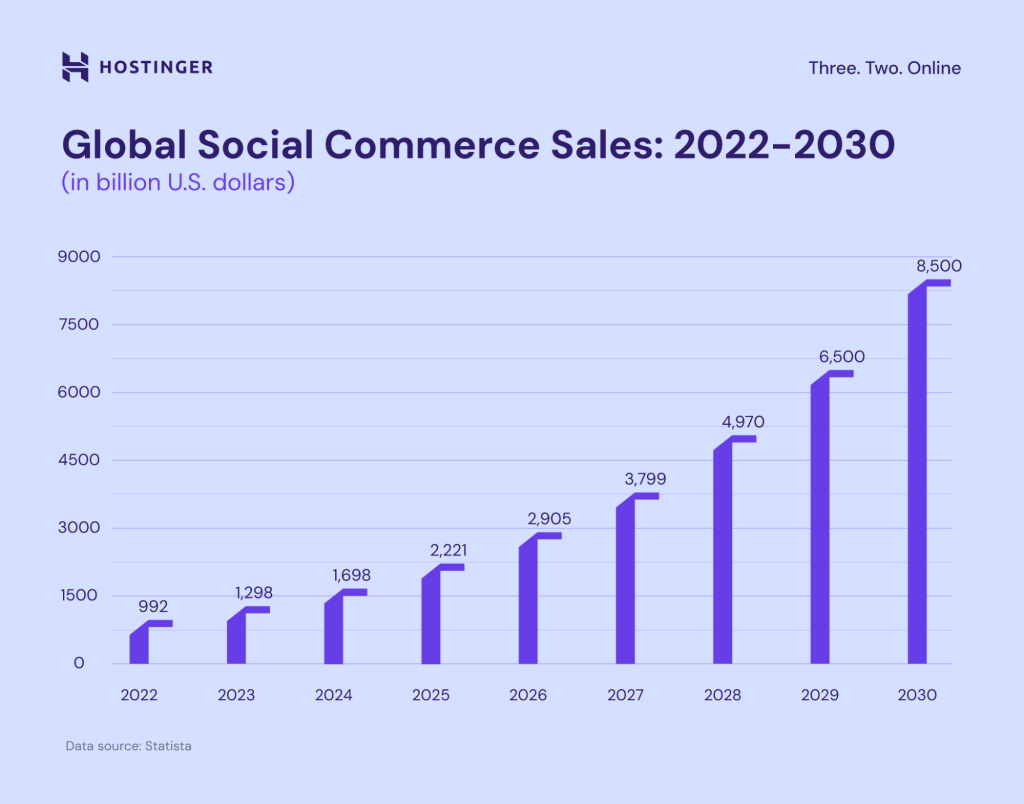
The global social commerce market hit $1.2 trillion in 2023. With a 30.7% annual growth rate, it’s set to grow sevenfold over the next seven years.
Social media shopping is gaining popularity in Asian countries and is rapidly becoming more common in the Middle East. Thailand leads the social media shopping trend, with 90% of its online users buying through social networks. India and the United Arab Emirates closely follow at 86%.
37. The U.S. social commerce market could surpass $149 billion by 2028
In 2023, the U.S. social commerce gross merchandise value (GMV) was estimated at $64.8 billion. With an 18.2% growth rate, the figure could reach nearly $150 billion in just five years.
More social media platforms are adding shopping features to tap into the thriving U.S. market. TikTok, for example, debuted TikTok Shop in 2023 and achieved a record-breaking $61.2 million GMV during Black Friday week. YouTube launched an affiliate marketing scheme around the same time, allowing creators to promote products on their videos.
38. Social data helps 90% of marketers to be more competitive
Most marketers agree that social media ramps up the competition. This is because social data reveals competitors’ brand loyalty, product strengths, weaknesses, and points of difference. So, 86% of marketers leverage this information for new business opportunities.
83% of marketers use Facebook to reach their target audience and conduct competitive analysis. This strategy caters to 60% of customers who prefer to engage brands with a Facebook presence. Instagram is the second favorite platform for marketers and consumers.
39. Facebook provides the best social commerce experience
In 2023, 23% of global consumers considered Facebook the leading social media platform for social shopping, surpassing Instagram.
Despite this, Instagram still surpasses Facebook as the world’s third most visited website, with a gap of 50 billion monthly views. Nonetheless, consumers tend to spend over a minute longer on Facebook than on Instagram, showing different engagement patterns.
Sources
- Oberlo
- Raydiant
- Statista
- Techjury
- Popupsmart
- Sprout Social
- Nosto
- Tidio
- Forbes
- Wyzowl
- Yaguara
- Zippia
- U.S. Census Bureau
- MobiLoud
- OnlineDasher
- Klarna Insights
- Brightlocal
- Harvard Business Review
- McKinsey & Company
- Future Market Insights
- Queue It
- Marketing Charts
- Research and Markets
- Linearity
- Social Shepherd
- MobiLoud
Main takeaways
The growing number of online shoppers is driving the rapid growth of eCommerce. With more people finding online shopping more convenient, opportunities to make money in the industry are greater than ever.
To make your online business stand out from the rest, it’s important to know how the eCommerce industry works and stay updated on the latest trends and market demands.
Prioritize factors that influence purchase decisions to reduce cart abandonment and boost sales. Most importantly, keep track of your online store’s performance to spot areas for improvement and quickly adapt to changing demands.
Methodology
The data for our study comes from a survey conducted by CXD Studio on behalf of Hostinger in August 2024. The respondents were 250 U.S. consumers who had purchased online in the past six months.
eCommerce statistics FAQ
What are the top challenges faced by eCommerce businesses in 2024?
eCommerce businesses must offer competitive pricing, as 26% of customers tend to shop elsewhere for better deals. Another challenge is meeting customer expectations by providing quality products, delivering them quickly, and keeping shipping costs reasonable. Transparency is also important, as inaccurate product descriptions and a lack of reviews significantly impact purchasing decisions.
How many people shop online?
As of September 2024, 2.71 billion consumers worldwide shop online. This figure is projected to surpass 3.9 billion in the next five years.
What percentage of people use eCommerce?
At the end of Q3 2024, 34% of the global population shopped online, a 2.7% increase from the previous year.
At what rate is eCommerce growing?
Global eCommerce revenue is expected to grow at an annual rate of 14.4%, according to Statista Market Insights. By 2027, the market is anticipated to reach $5.5 trillion in sales.
Who uses eCommerce the most?
In 2024, the fastest-growing eCommerce markets are in the Philippines, India, Indonesia, and Malaysia. For eCommerce penetration, China, Indonesia, the UK, and South Korea take the lead. China generates the highest eCommerce sales at over $3 trillion, followed by the U.S. and the UK with around $1 trillion each.

Jordana is a Senior Content Writer with over 5 years of experience in digital marketing and web development. When she’s not busy with work, she dabbles in creative writing and movie reviewing. Follow her on LinkedIn.