WordPress debug: What is it, how to enable it, and best practices
The WordPress debug mode is a built-in feature that lets you display and log error messages for more accurate troubleshooting. It is crucial for maintaining your website functionality, especially after adding custom code that might be triggering issues.
This tutorial will explain the WordPress debug mode and different ways to enable it. Since these methods suit different troubleshooting tasks, choose one based on your needs.
What is WordPress debug?
WordPress debug is a built-in feature that lets developers print and list error messages for troubleshooting. You can enable it by activating different PHP global variables like the WP_DEBUG and SCRIPT_DEBUG. Alternatively, you can debug WordPress by showing important data like script execution using a plugin.
How to enable WordPress debug with code
In this section, we will explain how to enable the WordPress debug mode using four different PHP variables based on your troubleshooting needs.
1. Enable WP_DEBUG
Activating WP_DEBUG is the most basic way to enable debugging in WordPress. It can check for PHP code issues in different website components, including themes and plugins.
To use the WP_DEBUG global variable, simply change its value in the wp-config.php file from FALSE to TRUE. Before doing so, ensure you can access your WordPress root folder using a file transfer protocol (FTP) application like FileZilla or your hosting provider’s file manager.
If you use an FTP client, you’ll have to download the PHP file, edit it on your computer, and re-upload it to your website.
To simplify the process, we will use Hostinger File Manager, which lets you edit wp-config.php directly in your web browser. Here are the steps:
- Log in to hPanel. Navigate to Websites → Dashboard → File Manager.
- Go to your WordPress public_html root folder.
- Open the wp-config.php file by double-clicking it.
- Find the following line. If you can’t locate this entry, manually add it after the $table_prefix = ‘wp_’; line:
define( 'WP_DEBUG', false );
- Change the value from false to TRUE.
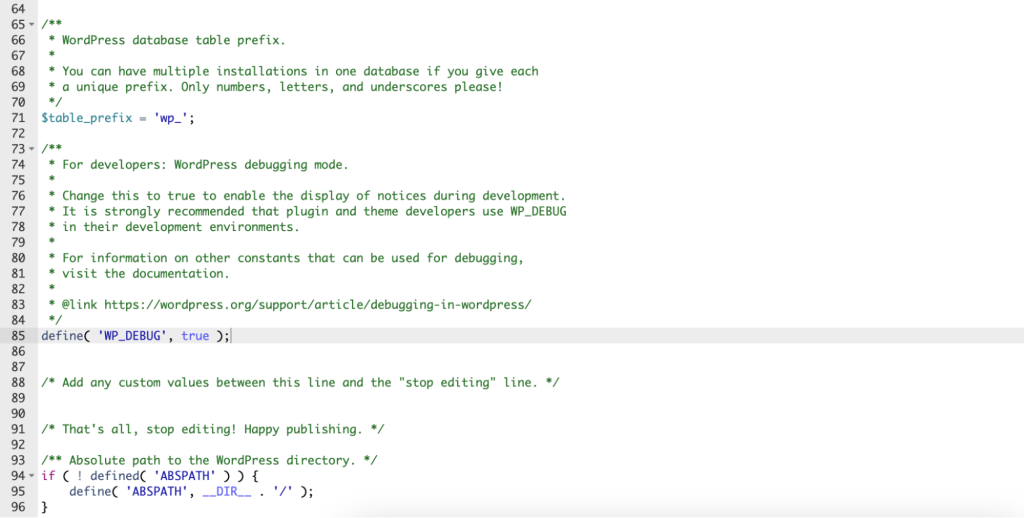
- Click the disk icon on the top right corner of the editor to save the changes.
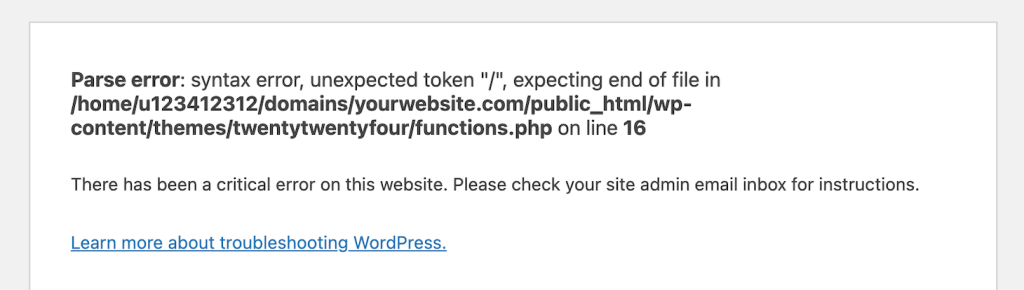
That’s it! If you encounter PHP issues, WordPress will print the error message on the front end.
WordPress provides additional PHP variables for modifying the debug mode. For example, WP_DEBUG_DISPLAY hides the error messages on the front end when set to FALSE to preserve the user experience.
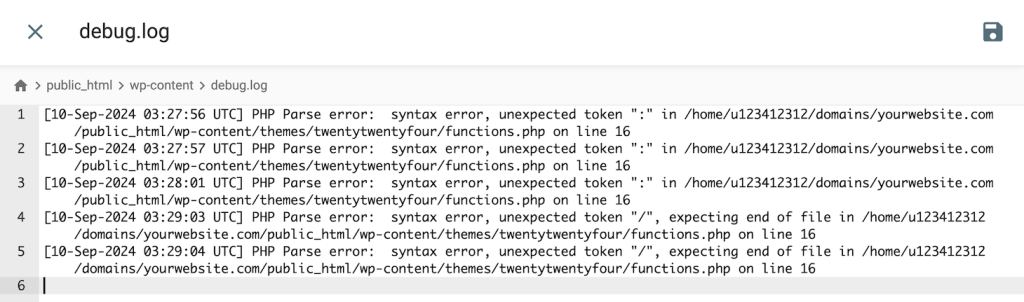
Developers typically use it with WP_DEBUG_LOG, which lists the PHP issues in the debug.log file inside the wp-content directory. Like WP_DEBUG, you add these variables to wp-config.php above the “That’s all, stop editing!” line. Your configuration should look like the following code:
if ( ! defined( 'WP_DEBUG' ) ) {

   define( 'WP_DEBUG', true );

   define('WP_DEBUG_DISPLAY', false);

   define('WP_DEBUG_LOG', true);

}
Remember that WordPress will log messages that occur after you activate the WP_DEBUG_LOG variable. If you want to document previous issues, you must manually replicate them.
Important! If you want to disable the WordPress debug mode, remember to set WP_DEBUG_DISPLAY and WP_DEBUG_LOG to FALSE to prevent these features from running indefinitely and wasting resources.
2. Enable SCRIPT_DEBUG
By default, WordPress runs minified JavaScript (JS) and CSS core files that hide non-essential features like error messages. While this behavior helps improve load time, it can make troubleshooting trickier since you can’t see the detailed information.
To debug core JS and CSS files, enable the dev versions using the SCRIPT_DEBUG variable. Doing so is especially useful after modifying your website’s appearance using these programming languages.
The steps to enable SCRIPT_DEBUG are similar to those for WP_DEBUG. Here’s how to do so using Hostinger File Manager:
- Open your WordPress public_html root folder.
- Double-click the wp-config.php file to open it.
- Find the following line and change the value from FALSE to TRUE. If you can’t find one, add it before the “That’s all stop editing” line.
define( 'SCRIPT_DEBUG', true );
- Click the disk icon on the top right to save the changes.
Now, if your website encounters core CSS or JavaScript-related issues, it should print error messages. After troubleshooting, remember to disable the variable and reactivate the minified core files to avoid performance issues.
3. Enable PHP error log
PHP has the built-in error_log() function that lets you log issues related to the scripting language. This feature runs on the server level, meaning it can debug all PHP applications in your hosting environment, including WordPress and its database.
You can enable the PHP logging by editing the php.ini file. However, several web hosting providers disable this feature due to design and security concerns.
If you use Hostinger managed WordPress plans, you can enable this feature via hPanel. Here’s how to do so:
- Log in to hPanel and head to Websites → Dashboard → sidebar → Advanced → PHP Configuration.
- Select the PHP options tab.
- Check the logErrors box to enable logging. If you want to display the error message on the front end, enable the displayErrors option. We recommend leaving it unchecked.
- Scroll down and hit Save.

You can access the log file by opening the .log directory within your server’s root folder. Here’s how to do so on Hostinger File Manager:
- On your hPanel dashboard, navigate to the sidebar → Files → File Manager.
- Click the Access all files of hosting button.
- Open the .log folder. If you can’t find this directory, it might be hidden. To show it, go to the sidebar → Settings and uncheck the Hide dotfiles box.
- Double-click the error_log_domain_tld file to see all PHP errors on your website, including their timestamps and types.
4. Enable WPDB error reporting
To debug your WordPress database, enable wpdb class’ show_errors variable. This setting will print SQL errors on your website, which helps troubleshoot database connection and syntax errors.
Here’s how to enable the WPDB error reporting via Hostinger File Manager:
- Open your WordPress website’s public_html folder → wp-includes.
- Double-click the class-wpdb.php file to open it.
- Find the class wpdb line.
- Within its brackets, find the $show_errors variable and change its value to TRUE like so:
public $show_errors = true;
- Click the disk icon to save the changes.
How to enable WordPress debug using a plugin
If you’re not comfortable working with code, you can enable the WordPress debug mode using a plugin. For example, WP Debugging lets you change the value of the WP_DEBUG variable directly from your admin dashboard.
After you download and install the plugin via the WordPress admin dashboard, follow these steps to enable the debugging mode:
- Go to the sidebar → Tools → WP Debugging.
- Check the Set WP_DEBUG to true box. Optionally, you can set whether you want WordPress to show the issues on the front end and ignore fatal errors.
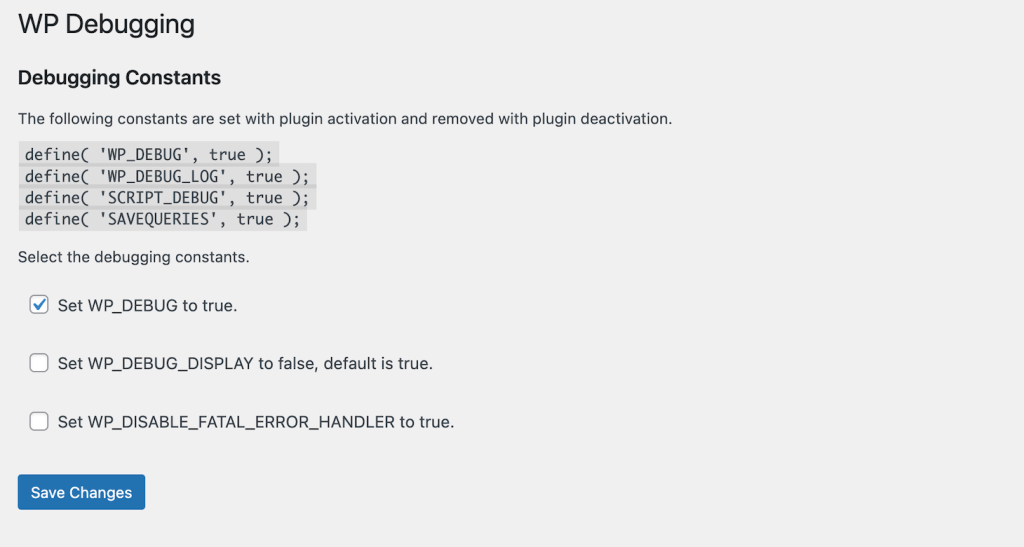
- Click Save Changes.
For a more comprehensive analysis than the default WordPress debugging feature, we recommend Query Monitor. It shows includes data for troubleshooting database queries, PHP calls, and script executions.
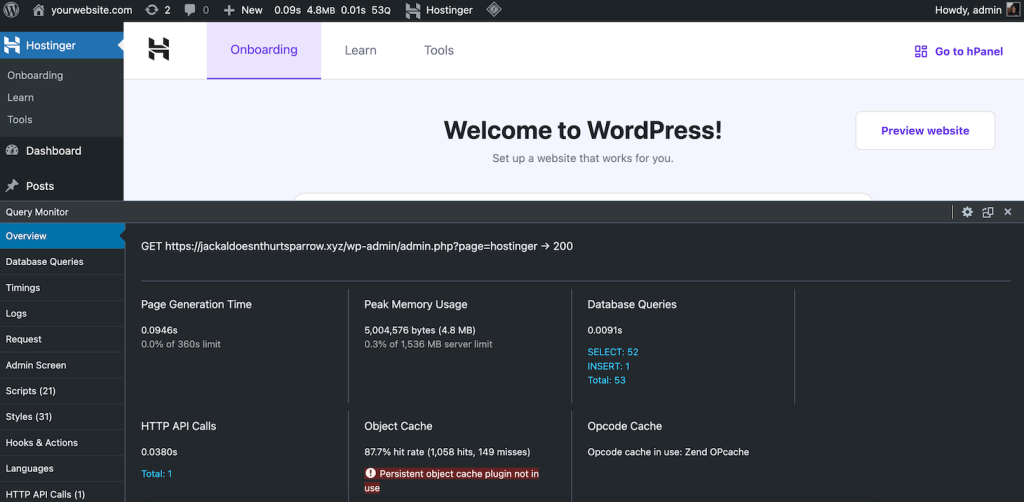
After you install the plugin, a menu will appear on your admin bar. Clicking it opens a window that details various data categories, such as:
- Overview – shows a summary of your WordPress website loading process, including the number of queries, memory usage, and page generation time.
- Database Queries – lists all the calls WordPress sends to the database when loading a web page, which is useful for checking SQL syntax errors or connectivity issues.
- Logs – contains any error messages from PHP components of your WordPress website that have the qm/debug action, like plugins.
- Scripts – displays all JavaScript files that WordPress loads when rendering a web page, including their position, source, and host.
- Styles – contains a list of CSS files WordPress uses to render a web page content, including their handler and position.
Several Query Monitor features, like logging, won’t work out of the box, and you must add the tracking code manually. The plugin provides a manual in each section to guide you through the setup.
Note that all logged-in users can see the plugin’s menu, potentially exposing sensitive information. To hide the debugging information, hide the WordPress admin bar for all accounts except administrators.
Need help troubleshooting your website?
Hostinger WordPress hosting’s AI Troubleshooter automatically warns you of any issues on your website. You can easily fix them by clicking the Fix errors button in hPanel.
WordPress debug best practices
These are best practices for an effective and secure troubleshooting process when debugging WordPress.
Avoid showing error messages
While error messages help you identify issues, displaying them on the front end might harm user experience.
A default error page also makes your website look less trustworthy. To avoid it, set up a redirect to another page so visitors can continue to navigate your site.
Moreover, some error messages might display parts of your WordPress website code. This might raise a security risk since cyber criminals can use this information to find potential entry points.
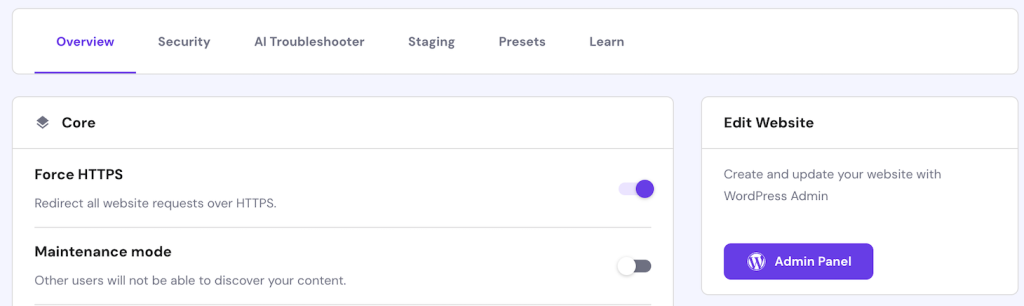
Enable the maintenance mode
When debugging or troubleshooting issues, it’s best to enable WordPress maintenance mode. This hides any error messages and redirects visitors to a specific landing page.
Hostinger users can easily enable the maintenance mode from hPanel. Go to Websites → Dashboard → WordPress → Overview. Then, click on the Maintenance mode toggle.
Note that this feature redirects users to the Hostinger’s default Maintenance page. If you want a custom design, use a plugin like LightStart.
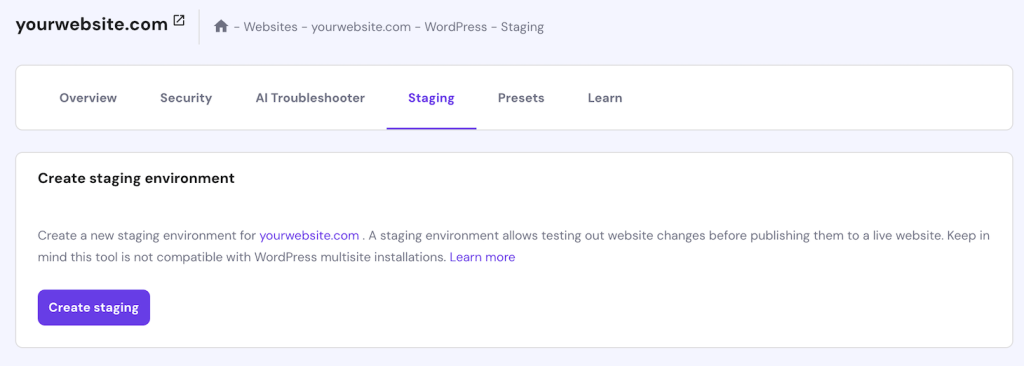
Use WordPress staging area
After debugging an error, we recommend testing the solution in a staging environment first before deploying it to the live site.
Hostinger users with the Business or higher plan can easily set up a WordPress staging environment by heading to hPanel → Websites → Dashboard → WordPress → Staging and clicking the Create staging button
Alternatively, you can also set up a staging site using a plugin like WP Staging or install a WordPress environment locally on your personal computer using a web stack such as XAMPP.
Conclusion
The WordPress debug mode lets developers display and log error messages for easier troubleshooting. To enable it, access your website’s root directory and open the wp-config.php file. Set the WP_DEBUG and WP_DEBUG_LOG variables to TRUE.
To display CSS and JavaScript core file errors, enable the dev version of these programming languages. To do so, open the wp-config.php file and set the SCRIPT_DEBUG parameter to TRUE.
You can also enable PHP’s built-in error logging feature by enabling the log_error() function in the php.ini file. Alternatively, Hostinger users can easily do so by activating the logErrors feature in hPanel’s PHP Configuration menu.
To check database issues, set the $show_errors variable in public_html/wp-includes/class-wpdb.php to TRUE. If you’re uncomfortable editing code, you can enable WP_DEBUG using the WP Debugging plugin or check the data directly using Query Monitor.
WordPress Debug FAQ
How do I check my WordPress debug mode?
To see if your WordPress debug mode is enabled, open your website’s public_html folder using an FTP client or your hosting provider’s file manager. Open wp-config.php and check if the define( ‘WP_DEBUG’, true) value is set to TRUE. FALSE means the debugging is disabled.
How do I see all the errors in WordPress?
To list all WordPress errors, set the WP_DEBUG_LOG and WP_DEBUG variables in wp-config.php to TRUE. Alternatively, you can enable the error_log() function in php.ini. Hostinger users can do so without coding by activating the logErrors setting in hPanel’s PHP Configuration menu.
Why is the WordPress debug log not created?
If WordPress doesn’t log errors, the WP_DEBUG_LOG variable is most likely set to FALSE. In addition, you must set the WP_DEBUG to TRUE and WP_DEBUG_DISPLAY to FALSE. If you use PHP’s error_log() function, the error log file should be located under the hidden .log folder.

Aris is a Content Writer specializing in Linux and WordPress development. He has a passion for networking, front-end web development, and server administration. By combining his IT and writing experience, Aris creates content that helps people easily understand complex technical topics to start their online journey. Follow him on LinkedIn.


Comments
September 04 2024
All my texts coming from republicans websites won’t open. They all show the 400 error message. How do I contact them to let them know??
September 05 2024
Hi Mary! The 400 error usually means there's a problem with the request being sent to the website. To fix this, you can try clearing your browser's cache or using a different browser/device. If the issue persists, you may need to contact the website's support team directly :)